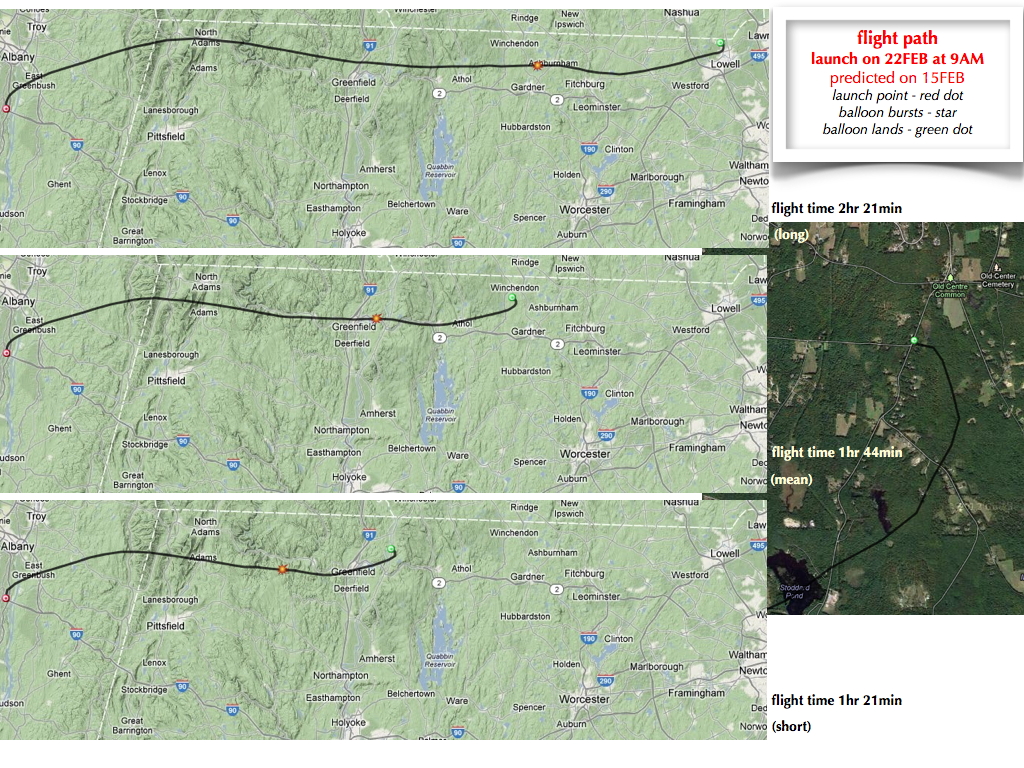
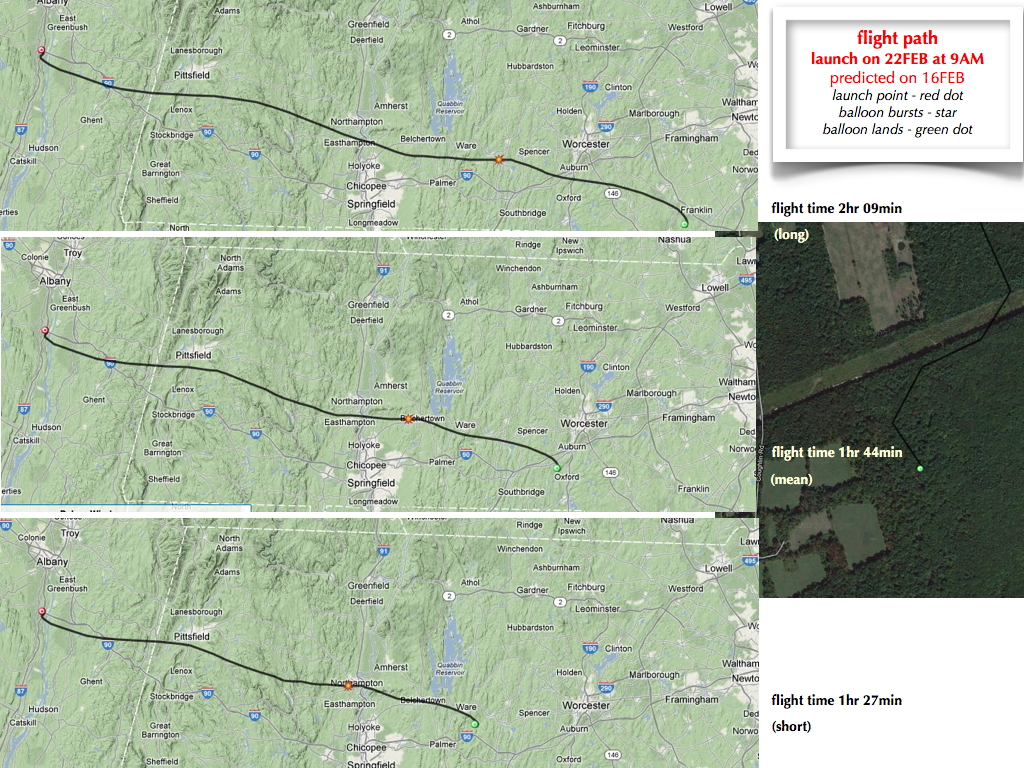
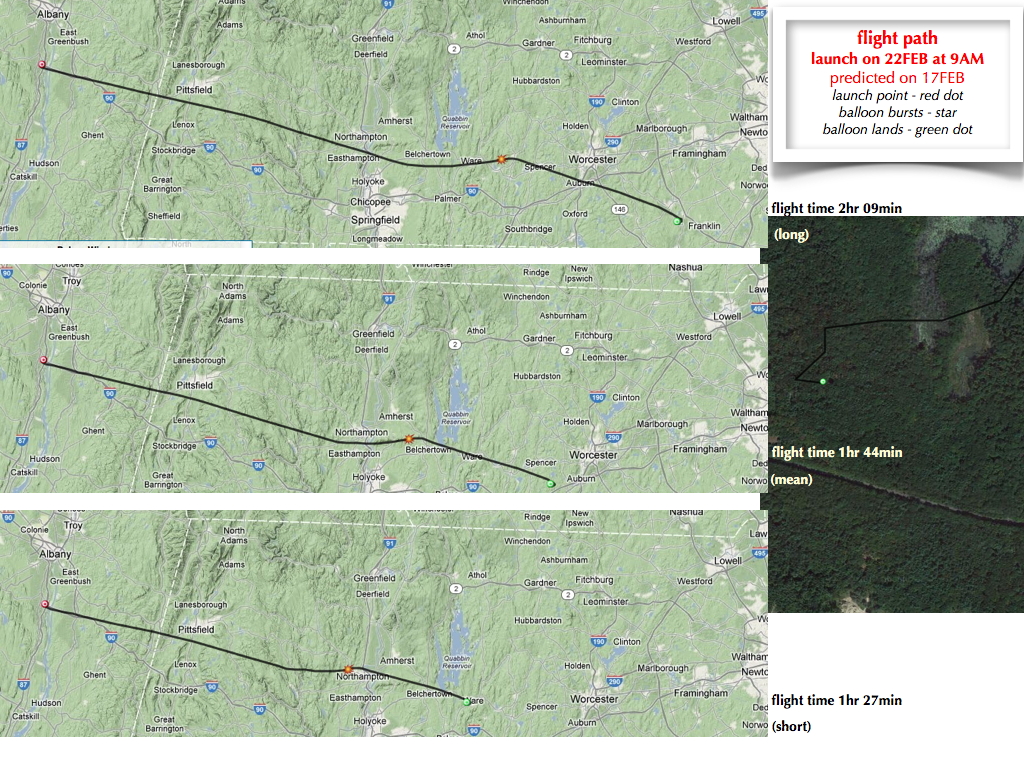
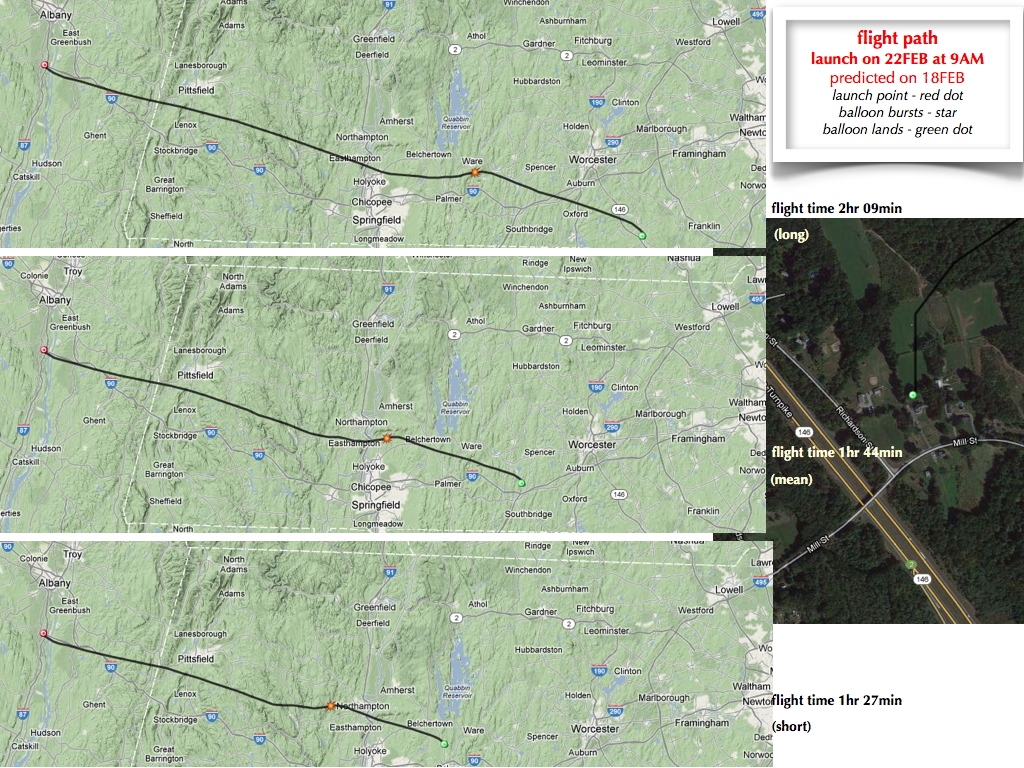
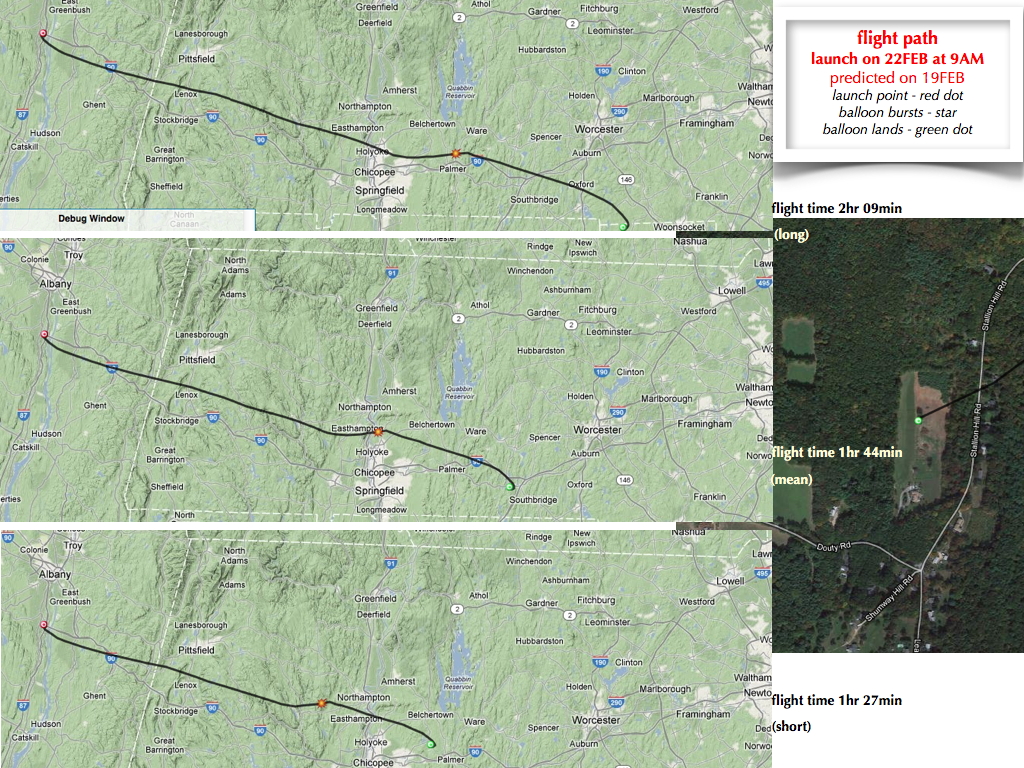
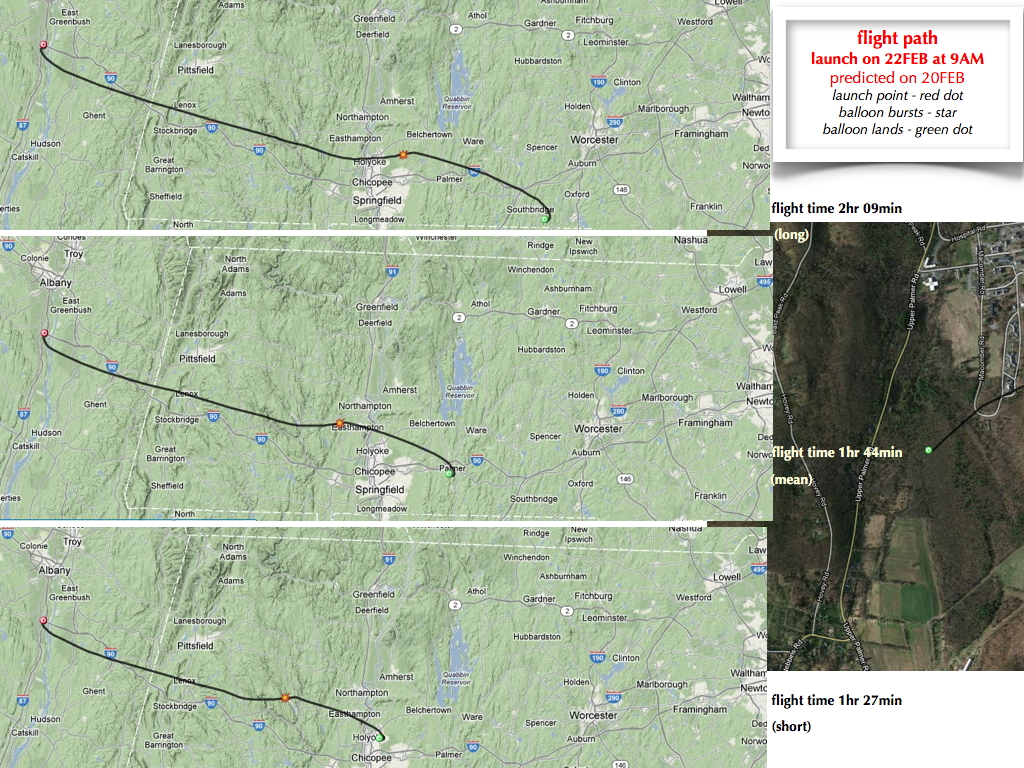
Evolution of Balloon Flight-Path Prediction
The sequence of images below demonstrates the evolution of the (CUSF-derived) balloon flight path, as the prediction is run each day, for a fixed launch date. The specific launch date was 22FEB at 9:00AM EST. Predictions were run on 15FEB, 16FEB, 17FEB, 18FEB, 19FEB, and 20FEB.
The same launch parameters - ascent rate, descent rate, burst altitude - were used on each run. Burst altitude was fixed at 30,000 m, ascent rate was 6.7 m/sec, the descent rate 7.5 m/sec. Also in each image, the ascent rate and descent rate were varied by +/-20% to provide a 'short' and a 'long' flight path relative to the 'mean' flight path.
Finally, a small image to the right of the mean flight path provides a satellite view of the predicted landing site, illustrating that in New England, landing in tall trees is a near-certainty!